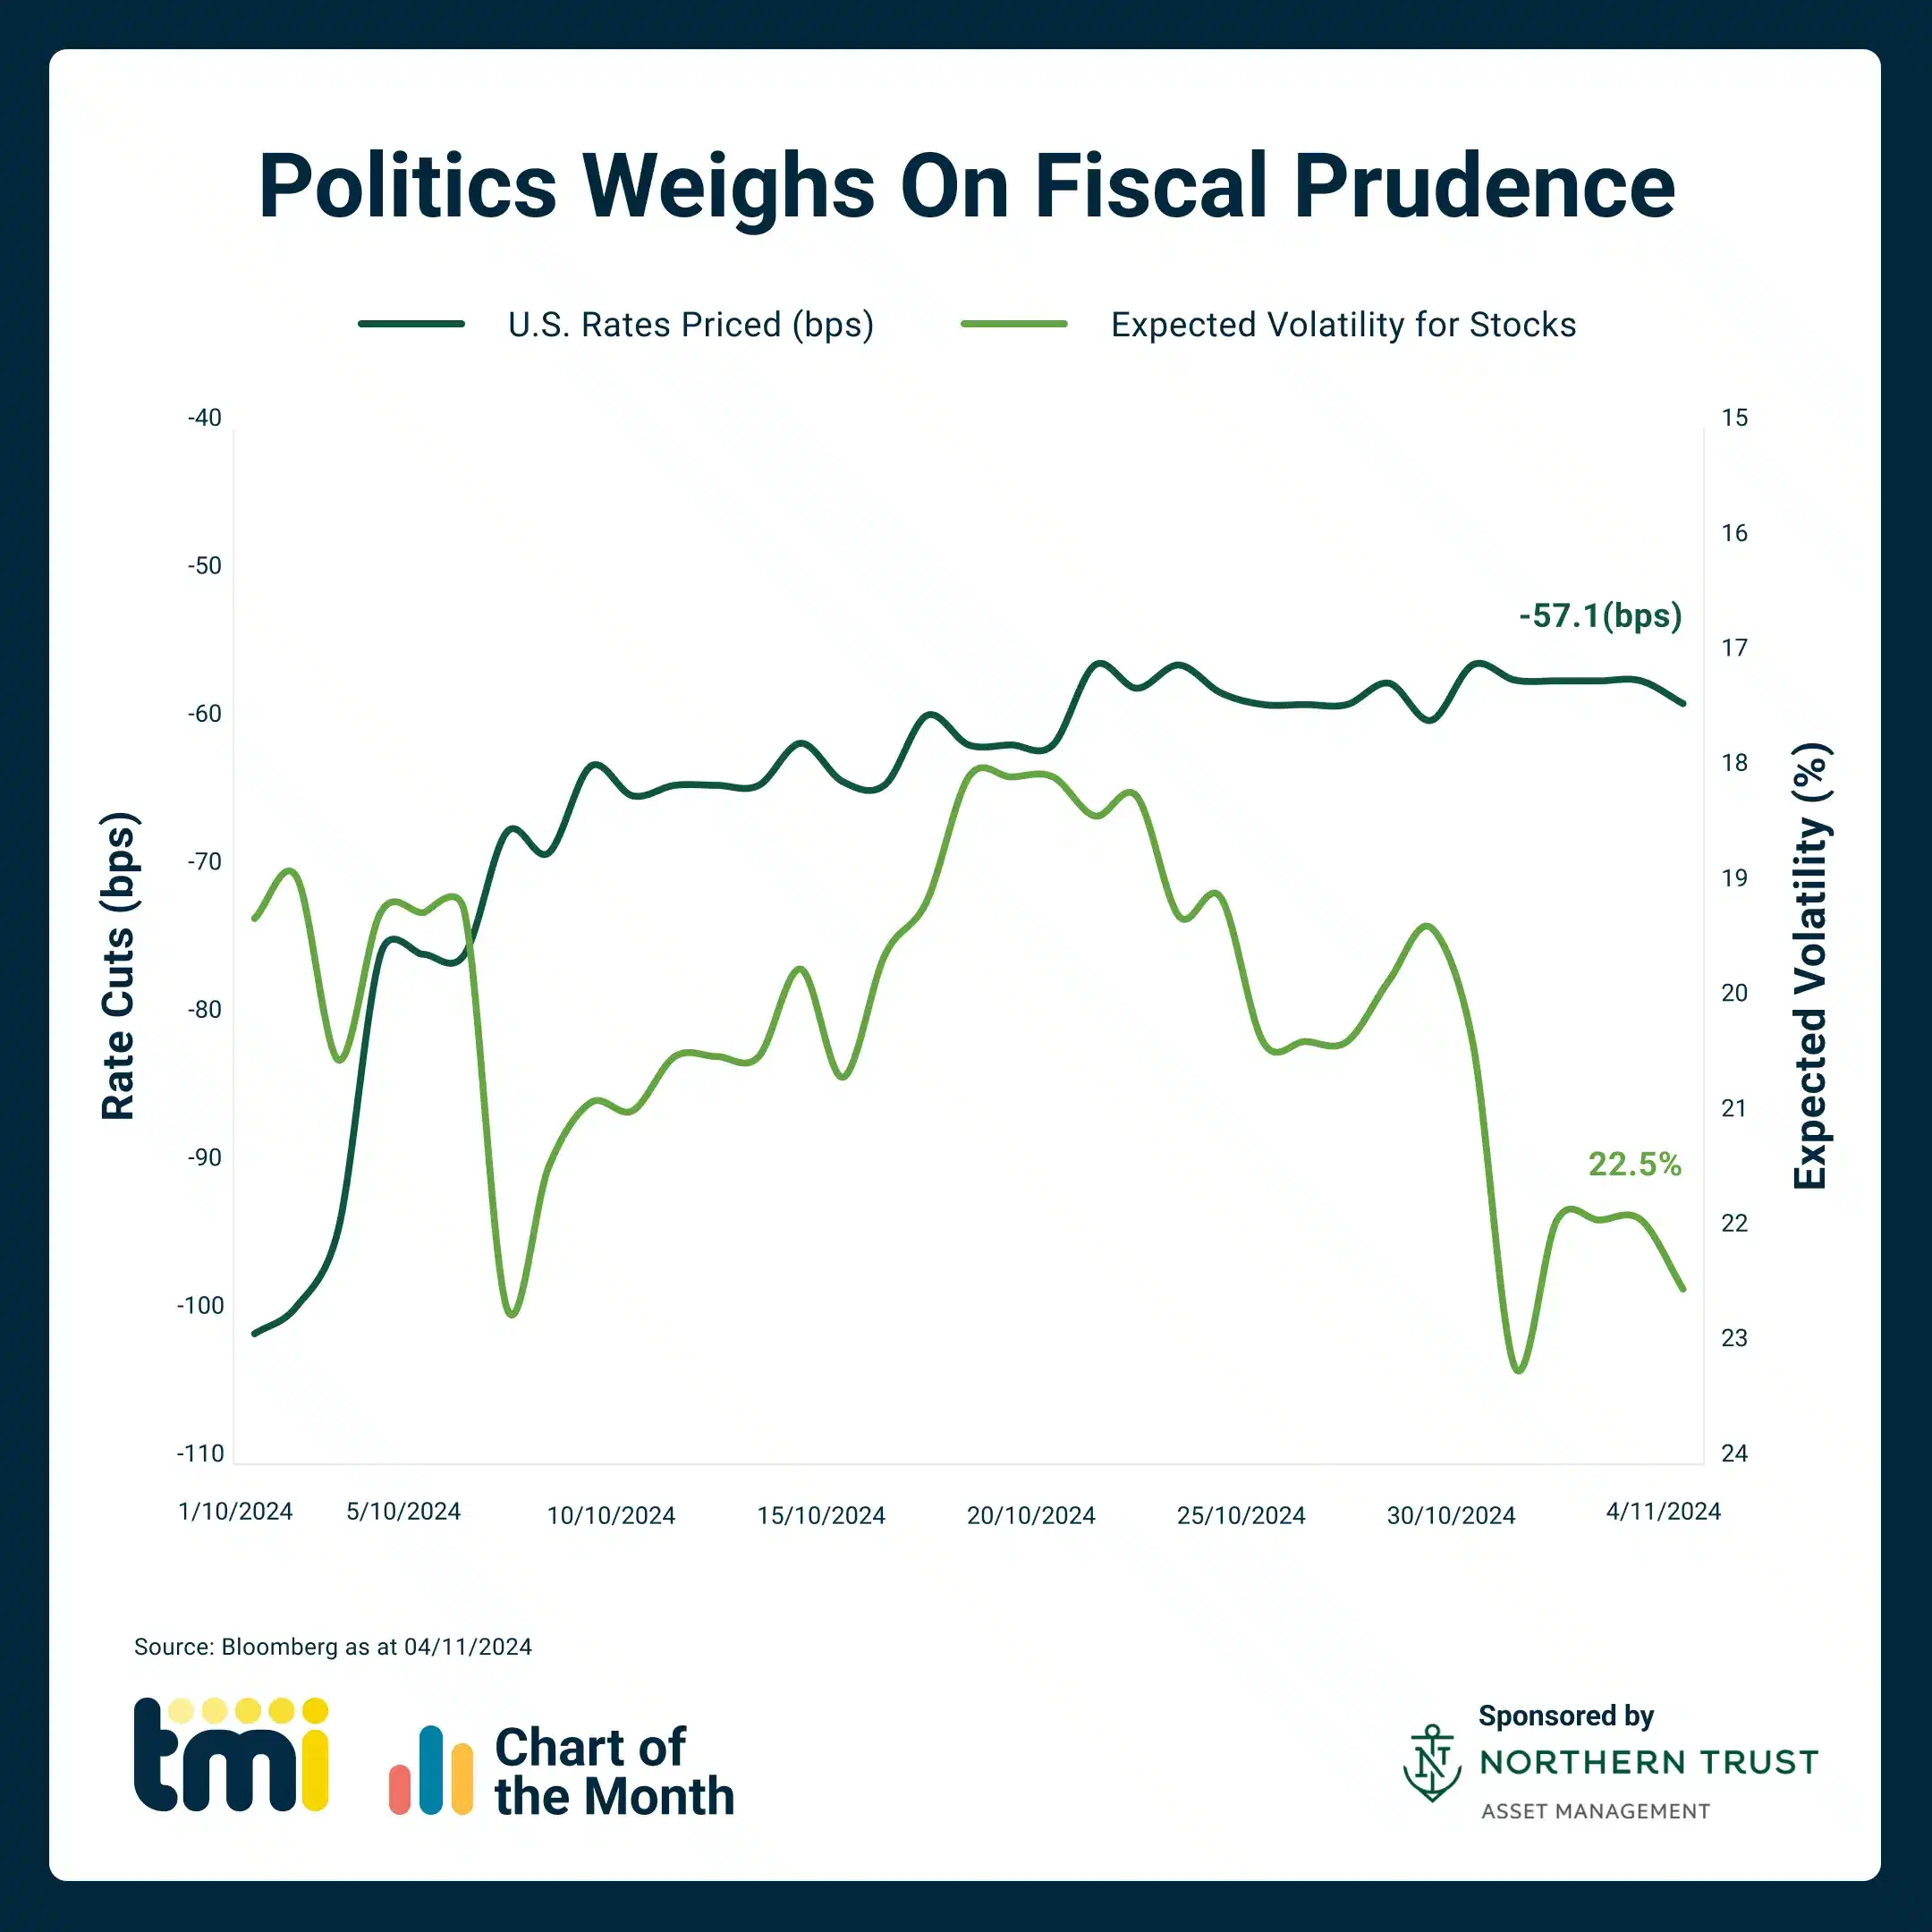
Chart of the Month: December 2025
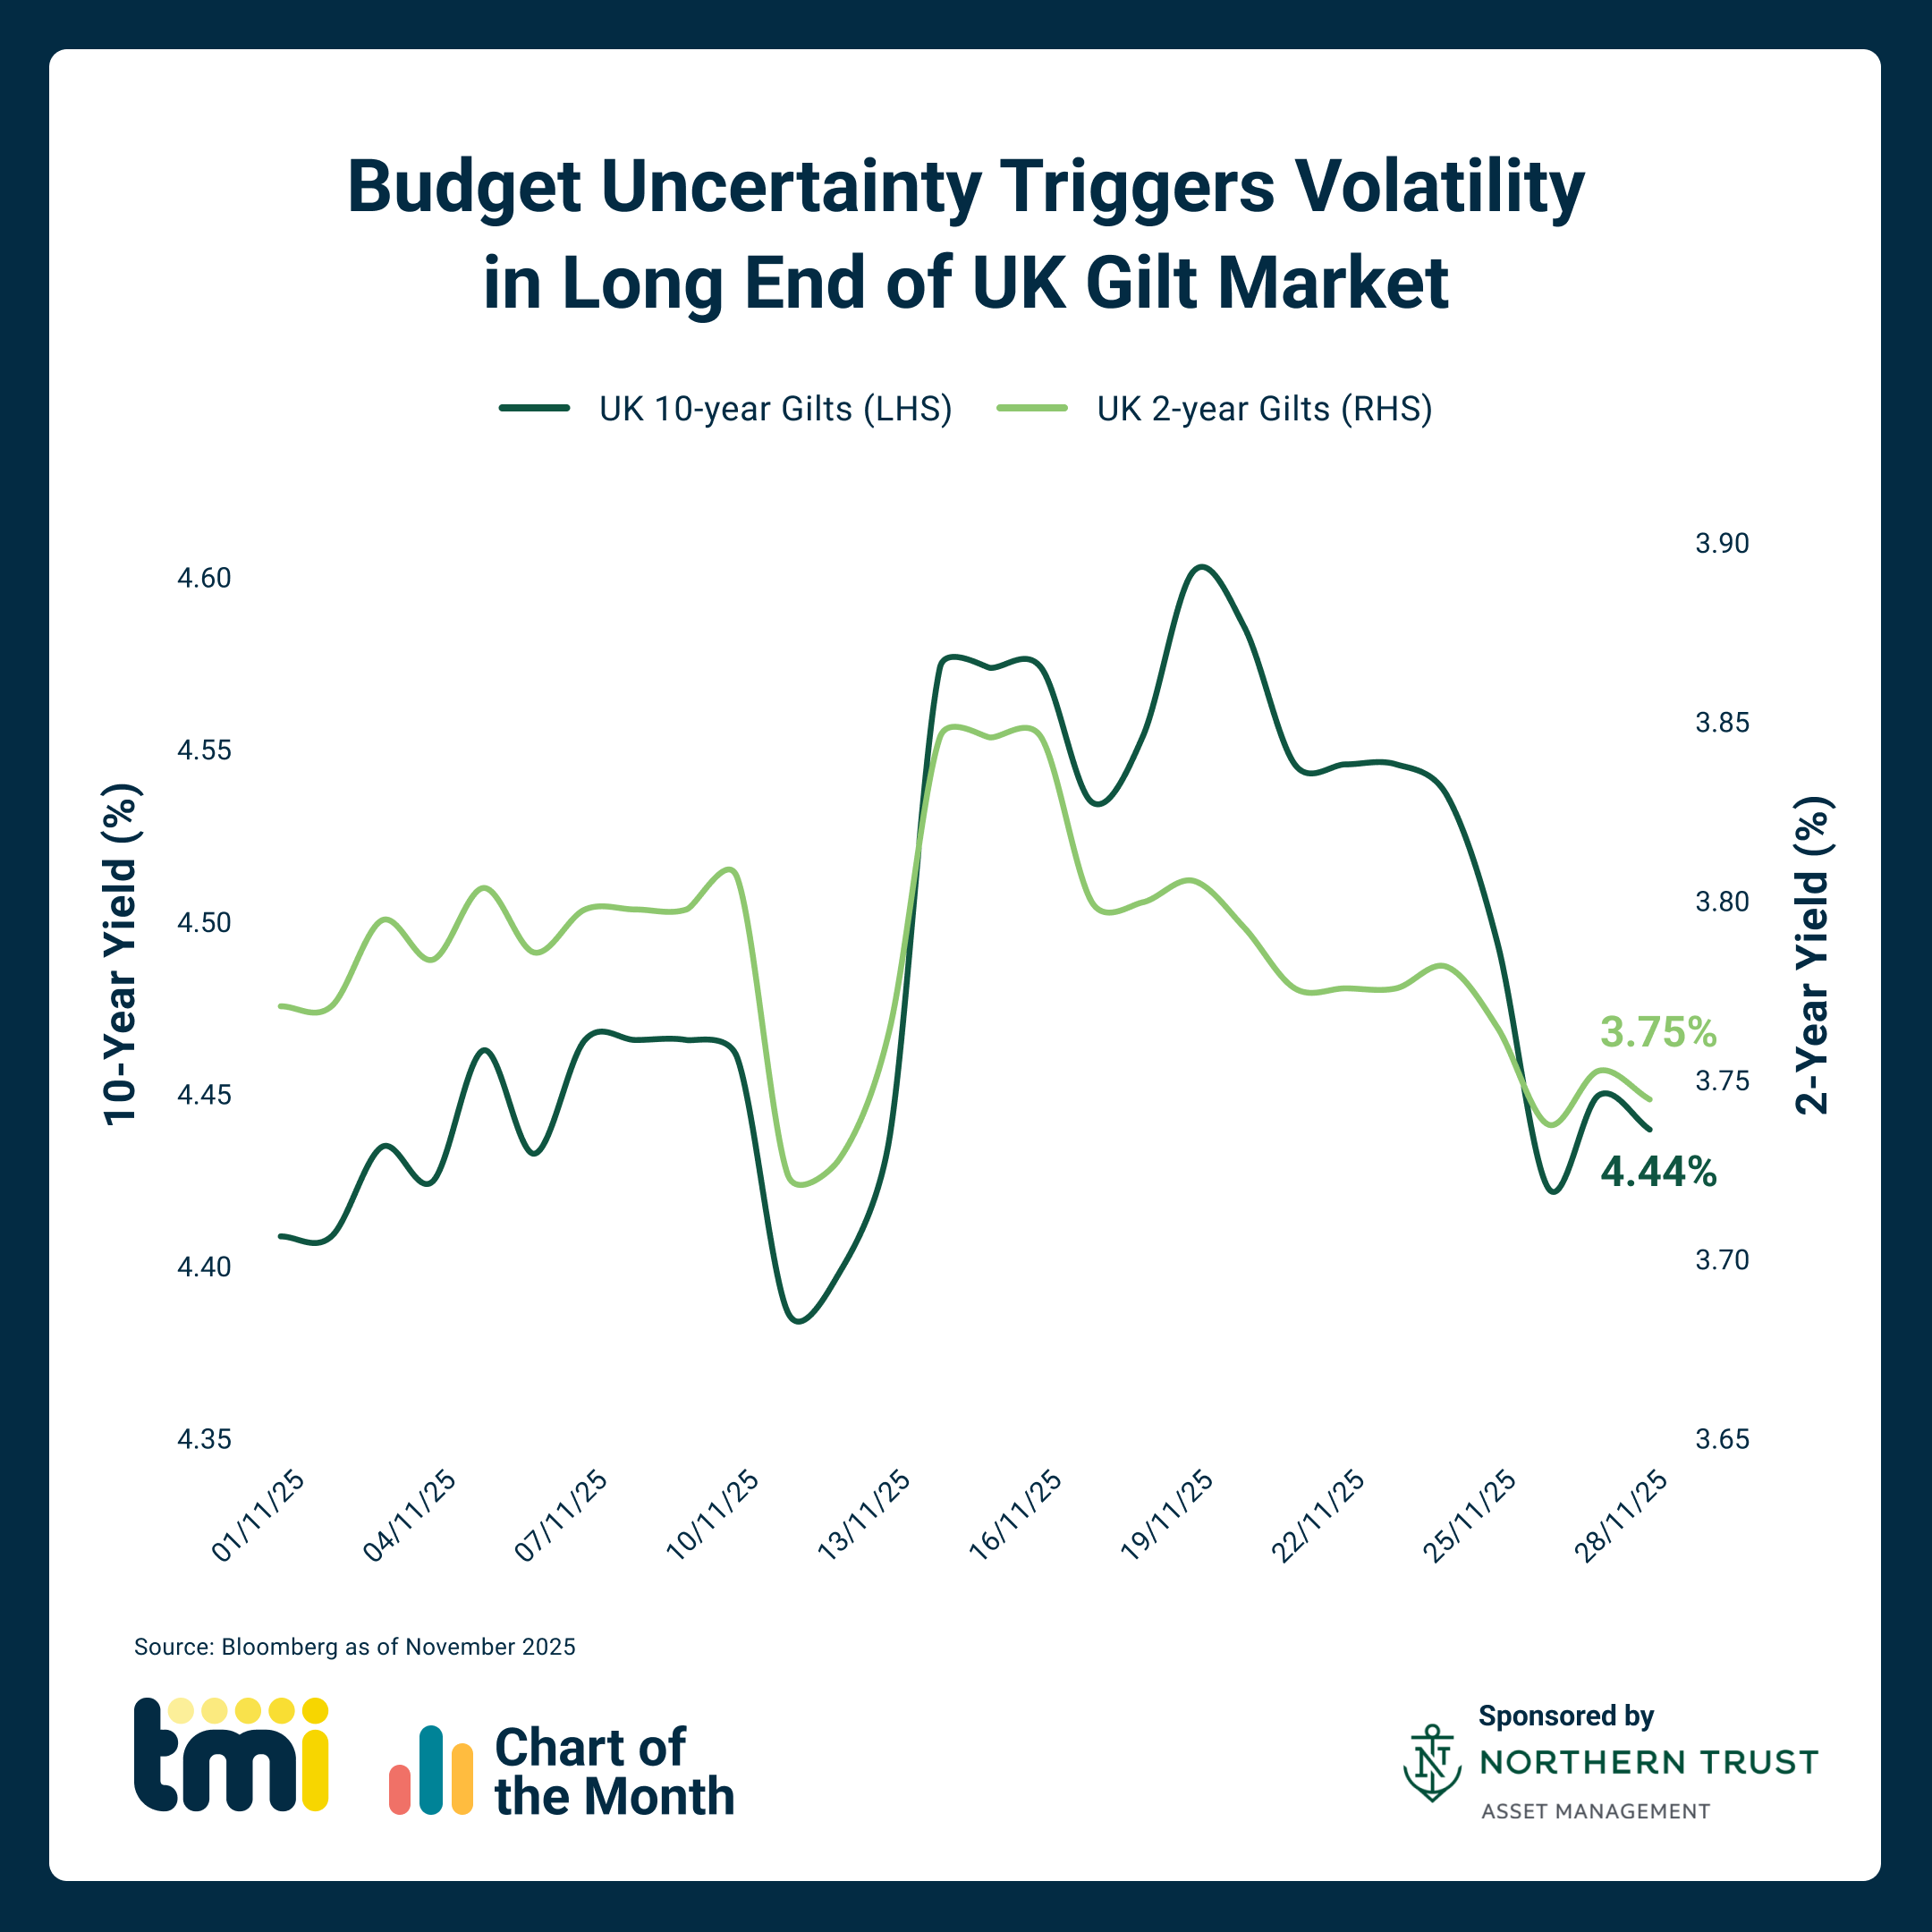
The long end of the UK gilt curve saw significant volatility in November, with 10-year yields swinging sharply due to budget leaks and shifting fiscal signals. In contrast, short-term gilts remained more stable, anchored by expectations of a rate cut in December and a further cut in Q1 2026. While term-premium dynamics drove a broader […]